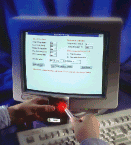
ACR POWERWATCH software

Compatible with Windows® 3.1, '95, '98, and NT

Chinese version

ACR products
ACR JR
ACR OWL
Smart Reader
Smart Reader Plus
Nautilus
Power Watch

Home
Product Overview
Product Specifications
Software
Accessories
About AXIOM & ACR
Contact us
Site map

ACR POWERWATCH Software

Features

  • MS Windows® compatible
  • Easiest software to use in the industry
  • User-selectable measurement units
  • Scrolling data display
  • Print to any Windows® compatible printer
  • Year 2000 compliant
PC to POWERWATCH Communications
How the POWERWATCH communicates with the PC

PC to POWERWATCH Communications
To setup, download, or view realtime information from a POWERWATCH Voltage Disturbance Recorder, all that's required is an LIC-101 Interface Cable that communicates with visible light. Simply aim the LIC-101 at the Optical Port and communication will begin automatically.
An LIC-101 cable is included with the POWERWATCH Interface Package. No tools, interface cards or docking stations required.

Product Specifications
PC Connector Female DB-9 pin connector.
Logger Connector Anodized aluminim optical connecting tube.
Cable Length 1.8 meters (6 feet).

ACR POWERWATCH software
ACR POWERWATCH software is a powerful and easy to use Windows® based power quality analysis program developed exclusively for the ACR POWERWATCH. For added productivity, there are no programming hassles or complex menus. As a result, information can be setup or downloaded in seconds.

Detailed Site Reports
Please click

Detailed Site Reports
Voltage Disturbances Displayed:

  • Hot to Neutral Surges
  • Neutral to Ground Surges
  • Hot to Neutral Sags
  • Hot to Neutral Impulses
  • Neutral to Ground Impulses
  • Outages
  • Frequency Variations
 
Setup Information Displayed:
  • The logger's setup parameters used
  • The site description
  • Filename used
  • Start and Stop date and time
  • Recorder serial number
     
     
Statistical Analysis
Please click

Statistical Analysis
A large number of events can be quickly analyzed by using the quick summary option. Quick summary totals all the surge, sag and impulse events and displays all of their occurrences individually in a bar graph format. This format helps determine power quality trends quickly and effectively.

Event Distribution Graph
Please click

Event Distribution Graph
The Event Distribution Graph plots the magnitude of events against duration on a logarithmic scale, allowing you to determine the importance of the data. (A single random event may not be as important as a cluster of events.) The Event Distribution Graph helps you to determine what kind of power quality problems you have, and to decide what kind of protection is best. All 4000 events can be plotted on this graph. You have the choice of analyzing hot to neutral events or neutral to ground, and of showing both in different colours. The CBEMA Curve can be used to determine the importance of each event.

Order Information
MODEL DESCRIPTION CATALOG#
PWV-100 ACR POWERWATCH Complete Interface Package including LIC-101, and manuals. 01-0060

Home | Product Overview | Product Specifications | Software | Accessories | About AXIOM & ACR | Contact us Site map

You are visitor number since 10th May 2000